[Flexible Designs für klinische Studien – eine grafische Repräsentation in Form eines Wahrscheinlichkeitsbaums]
Martin Hellmich 11 Institute of Medical Statistics, Informatics, and Epidemiology, Cologne University Hospital, Cologne, Germany
Zusammenfassung
Hintergrund: Flexible Designs für klinische Studien erlauben eine bessere Anpassung laufender Untersuchungen an aktuelle Umstände, wie z.B. eine unerwartet kleine Effektgröße, ohne die statistische Fehler-Kontrolle zu durchbrechen. Die vorhandenen statistischen Verfahren sind jedoch komplex.
Methodik: Ein zweistufiges, flexibles Design wird in Form eines einfachen Wahrscheinlichkeitsbaums repräsentiert. Kritische Grenzen, die einer Zwischenauswertung Rechnung tragen, werden mittels fundamentaler Regeln der Wahrscheinlichkeitsrechnung abgeleitet.
Schlussfolgerung: Mithilfe eines Wahrscheinlichkeitsbaums können die Prinzipien flexibler Studiendesigns einfach kommuniziert werden und somit hoffentlich zu guter Planung und Durchführung von klinischen Studien beitragen.
Schlüsselwörter
Adaptation, Flexibles Design, Meta-Analyse, Wahrscheinlichkeitsrechnung, Zwischenauswertung
Introduction
Planned interim analyses of clinical trials may help to assess whether ongoing trials can realistically be expected to answer its primary question(s). Flexible or adaptive designs have been advocated as a means to straighten out specific design errors such as an unexpectedly high variability and low effect size, thus possibly rescuing hampered experiments and accelerating the development of effective interventions [1]. Regulatory guidance on the proper/improper use of flexible designs in drug development, e.g. with seamless phases II and III, is currently being compiled [2]. By means of a simple yet novel chance tree I aim to make the fundamentals of flexible trial design, particularly (multiplicity) adjustment of critical limits for interim analysis, accessible to a broad audience.
Meta-analysis within the same trial
The basic idea of adaptive design is to decompose a clinical trial into separate stages which results are then recombined in a within-trial meta-analysis [3]. Various statistical methods are available for decision making, effect estimation and calculation of confidence intervals including, for example, combination of the p-values from the separate trial stages by Fisher’s combination test or the inverse normal method [4]. An alternative, very general formulation is based on the conditional error function α(p1) which specifies the amount of conditional type I error to be spent for the second trial stage given the p-value p1 from the first stage of the trial [5], [6]. Unmasked results from precedent stages may serve to optimize the design/power of subsequent stages without compromising the type I error control. Popular group-sequential plans, e.g. employing O’Brien-Fleming or Pocock stopping boundaries, are special instances of flexible design albeit without any major design modification such as adaptation of the maximum sample size, selection of a subpopulation, dropping treatment arms or changing endpoints/ hypotheses.
Two-stage designs based on Fisher’s combination test
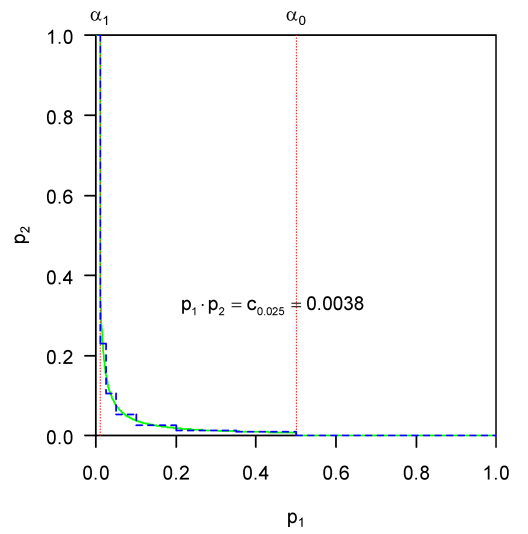
Assume a single one-sided null hypothesis H0, e.g. treatment A is not superior to treatment B, is to be tested at level α in a two-stage design. Let p1 and p2 be the corresponding one-sided p-values from the separate, independent samples of the first and second stage, respectively. Boundaries α1 and α0 with α1<α<α0 for early stopping with rejection or acceptance of H0, respectively, need to be fixed in the trial protocol. The choice of α2≤α determines the α-spending between the interim analysis (local level α1) and the final combination test (local level α2) [7], [8]. To obtain a level-α test procedure the quantities α, α0, α1, α2 and the critical limit ![]() , where
, where ![]() denotes the (1–α) quantile of the central χ2-distribution with 4 degrees of freedom for the final combination test, must fulfil the constraint
denotes the (1–α) quantile of the central χ2-distribution with 4 degrees of freedom for the final combination test, must fulfil the constraint ![]() , i.e. α1 is iteratively determined given α and α2. For example, for α0=0.5 and α2=α=0.025, c0.025=0.0038 and α1=0.0102. This procedure can also be defined in terms of the conditional error function
, i.e. α1 is iteratively determined given α and α2. For example, for α0=0.5 and α2=α=0.025, c0.025=0.0038 and α1=0.0102. This procedure can also be defined in terms of the conditional error function
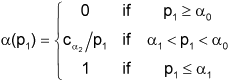
where ![]() (by definition) and H0 can be rejected after the second stage if p2≤α(p1) [9].
(by definition) and H0 can be rejected after the second stage if p2≤α(p1) [9].
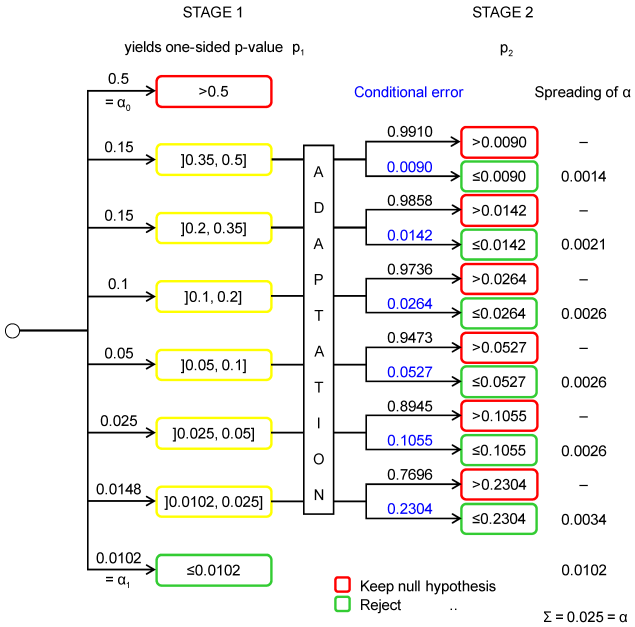
Chance tree of a two-stage adaptive design
A chance tree is a tree-like graph of chance event outcomes (so-called “nodes”). The probabilities of all directly successive nodes to a specifc node sum to one. The probability of a specific branch of the tree equals the product of all probabilities along this branch, and the probability of a bundle of branches equals the sum of all probabilities of branches contained.
A chance tree which under the null hypothesis approximates a simple two-stage adaptive design based on Fisher’s combination test is shown in Figure 1 [Fig. 1] [3]. The number and position of intervals for p1 (i.e. the nodes) were chosen to approximate the continuous decision boundary in a simple illustrative way. The boundaries of both adaptive tests are depicted in Figure 2 [Fig. 2]. The one-sided type I error α to be spread over all branches is 0.025. To approximate the smooth curve ![]() over the interval ]x1,x2] by a step function, the partial area under the curve was calculated by
over the interval ]x1,x2] by a step function, the partial area under the curve was calculated by ![]() and then divided by x2–x1. If the one-sided p-value p1 of the first stage is greater than α0=0.5 the trial is stopped. If p1 is less or equal α1=0.0102 the null hypothesis is rejected and the trial is stopped. If p1 is intermediate, i.e. less or equal α0=0.5 and greater than α1=0.0102, a second stage may be designed and conducted yielding the one-sided p-value p2. If p2 is less than or equal the type I error “conditional on p1” the null hypothesis is rejected, and accepted otherwise. The conditional error is the (constant) density of α in the interval containing p1, e.g. 0.1055≈0.0026/(0.05–0.025) (error due to rounding) where 0.0026 is the area under the conditional error function over the interval ]0.025, 0.05]. Thus if a p-value p1 between 0.025 and 0.05 is obtained at the first stage, the null hypothesis can be rejected at the second stage if p2 is less or equal 0.1055 else it is retained. The other first stage nodes, i.e. the intervals ]0.35, 0.5], ]0.2, 0.35], ]0.1, 0.2] and ]0.0102, 0.025], are dealt with analogously. Note, each combination of a p1-branching (i.e. a partition of the interval [0, 1]) with a distribution of α over branches defines a different adaptive test. A similar chance tree can be grown to illustrate the (conditional) power of the adaptive procedure in any specific setting.
and then divided by x2–x1. If the one-sided p-value p1 of the first stage is greater than α0=0.5 the trial is stopped. If p1 is less or equal α1=0.0102 the null hypothesis is rejected and the trial is stopped. If p1 is intermediate, i.e. less or equal α0=0.5 and greater than α1=0.0102, a second stage may be designed and conducted yielding the one-sided p-value p2. If p2 is less than or equal the type I error “conditional on p1” the null hypothesis is rejected, and accepted otherwise. The conditional error is the (constant) density of α in the interval containing p1, e.g. 0.1055≈0.0026/(0.05–0.025) (error due to rounding) where 0.0026 is the area under the conditional error function over the interval ]0.025, 0.05]. Thus if a p-value p1 between 0.025 and 0.05 is obtained at the first stage, the null hypothesis can be rejected at the second stage if p2 is less or equal 0.1055 else it is retained. The other first stage nodes, i.e. the intervals ]0.35, 0.5], ]0.2, 0.35], ]0.1, 0.2] and ]0.0102, 0.025], are dealt with analogously. Note, each combination of a p1-branching (i.e. a partition of the interval [0, 1]) with a distribution of α over branches defines a different adaptive test. A similar chance tree can be grown to illustrate the (conditional) power of the adaptive procedure in any specific setting.
In a more precise approach, nodes (i.e. their number and position) may be chosen to keep the approximation error below any absolute (or relative) bound. Conditional on a fixed number of nodes this error may also be minimized over position (i.e. location and width of intervals). In the same way other p-value combination functions ρ can be approximated such as the inverse normal method defined by
![]()
(Φ–1 denotes the inverse of the standard normal distribution function) with corresponding conditional error function
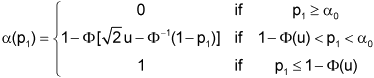
where u is the one-sided critical value of the two-stage group sequential test with provision for early stopping in favour of H0 [3], [4], [5].
Conclusions
Flexible designs can be represented in form of a chance tree which is an intuitive mathematical tool most clinicians are familiar with from decision analysis. Thus, the principles of adaptive testing may be explained and communicated more easily, hopefully adding to good design and conduct of biomedical investigations.
Notes
Conflicts of interest
None declared.
Acknowledgment
The author thanks Walter Lehmacher, Gernot Wassmer and two anonymous reviewers for comments which helped to improve the presentation of the paper.
References
[1] O'Neill RT. FDA's critical path initiative: a perspective on contributions of biostatistics. Biom J. 2006;48(4):559-64. DOI: 10.1002/bimj.200510237[2] Committee for Medicinal Products for Human Use. Reflection paper on methodological issues in confirmatory clinical trials with flexible design and analysis plan. London: European Medicines Agency; 2006. Doc. Ref. CHMP/EWP/2459/02. Available from: http://www.emea.europa.eu/pdfs/human/ewp/245902en.pdf
[3] Bauer P, Köhne K. Evaluation of experiments with adaptive interim analyses. Biometrics. 1994;50(4):1029-41. Correction: Biometrics. 1996;52:380. DOI: 10.2307/2533441
[4] Lehmacher W, Wassmer G. Adaptive sample size calculations in group sequential trials. Biometrics. 1999;55(4):1286-90. DOI: 10.1111/j.0006-341X.1999.01286.x
[5] Proschan MA, Hunsberger SA. Designed extension of studies based on conditional power. Biometrics. 1995;51(4):1315-24. DOI: 10.2307/2533262
[6] Müller HH, Schäfer H. Adaptive group sequential designs for clinical trials: combining the advantages of adaptive and of classical group sequential approaches. Biometrics. 2001;57(3):886-91. DOI: 10.1111/j.0006-341X.2001.00886.x
[7] Bauer P, Röhmel J. An adaptive method for establishing a dose-response relationship. Stat Med. 1995;14(14):1595-607. DOI: 10.1002/sim.4780141410
[8] Bauer P, Kieser M. Combining different phases in the development of medical treatments within in a single trial. Stat Med. 1999;18(14):1833-48. DOI: 10.1002/(SICI)1097-0258(19990730)18:14<1833::AID-SIM221>3.0.CO;2-3
[9] Posch M, Bauer P. Adaptive two stage designs and the conditional error function. Biom J. 1999;41(6):689-96. DOI: 10.1002/(SICI)1521-4036(199910)41:6<689::AID-BIMJ689>3.0.CO;2-P