Anatomy-based fitting versus standard mapping of cochlear implants: A study on speech perception and hearing quality
Marten Geisen 1Silke Helbig 1
Tobias Weißgerber 1
Timo Stöver 1
Uwe Baumann 1
1 Goethe-University Frankfurt, University Hospital, ENT-Department, Frankfurt a. M., Germany
Abstract
The study aims to investigate the speech intelligibility and sound quality rating of adults who have been fitted with a cochlear implant (CI) for the first time with two different frequency distributions of the filter bank of the CI audio processor. A patient-specific anatomy-based filter bank setting is compared with the standard filter bank setting specified by the manufacturer. The study is being conducted as a prospective, randomized, and single-blinded crossover study with each subject taking part over a period of 9 months. To date, 53 adults who have been fitted with a cochlear implant for the first time were included in the study, which is still ongoing. The patients were randomly assigned to groups with two different starting conditions at the beginning of the study: anatomy-based frequency allocation (ABF) and standard group (STD). Postoperative cone beam tomography (CBT) images were analyzed using Otoplan® software (Cascination, Bern, Switzerland) to determine the insertion angle and the corresponding center frequencies of the intracochlear electrode contacts and to create an “anatomy-based” frequency allocation of the center frequencies of the filter bank. A total of three visits are planned in a 3-month cycle. In the first visit after 3 months, the alternative frequency allocation is set (crossover), in the second visit both settings are made available to the subjects, and in the third visit, the results are evaluated with both variants. Speech comprehension in quiet (Freiburg monosyllables) and in background noise (Oldenburg sentence test) was tested and hearing quality assessed using questionnaires. The results so far show that there is no statistically significant difference between the two frequency allocations at any visit (p>0.5). On the first and last visits, there was a trend toward better hearing quality with ABF, while this trend was reversed at the second visit after the program was changed. The preliminary results indicate that the anatomically determined frequency allocation of the bandpass filter center frequency setting may facilitate enhanced hearing quality while maintaining unimpaired speech perception in quiet.
Keywords
cochlear implant, anatomy-based fitting, frequency mapping, crossover design
1 Introduction
Patients with profound hearing loss or deafness can receive a cochlear implant (CI) to improve their aided hearing capabilities in the long term. Although CIs offer great advantages, users may experience hearing with a CI uncomfortable and sometimes disturbing, especially in the initial phase. Hearing performance of CI users varies considerably even after a longer period of acclimatization and is often inadequate in real-life listening situations with background noise [1]. One possible reason for the impaired hearing quality could be the allocation of the center frequencies of the filter bank of the audio processor specified by the manufacturer, which is the same for all patients [2]. When the audio processor is first activated, a standard frequency allocation is usually set without taking into account the individual cochlear anatomy and the exact position of the electrodes. However, cochlear duct length (CDL) and electrode insertion depth varies individually, so that the electrical frequency bands at a particular intracochlear position can deviate from the physiological frequency allocation by up to two octaves. This study investigates whether anatomy-based fitting (ABF) adapted to the individual position of the electrodes can improve sound quality and speech perception compared to conventional frequency distribution.
2 Methods
53 patients (62 ears) have been included in the study so far (25 m, 28 f, mean age 58 years). A total of 24 subjects have already completed the study. At the time of data collection, 17 subjects had single-sided deafness (SSD), 25 were bimodal, 2 were unilateral and 9 were bilateral. In 4 subjects, electric-acoustic stimulation (EAS) was available or had been attempted in advance. Except for one participant who underwent implantation with a Cochlear CI612 (COCHLEAR, Macquarie, Australia) utilizing the Nucleus 8 audio processor, all other participants received Synchrony 2 implants (MED-EL, Innsbruck, Austria), with the selection of electrode length based on cochlear duct length (CDL). Rondo 3 or Sonnet 2 devices were used as audio processors. A total of 1 Flex24, 4 Flex26, 32 Flex28, and 23 FlexSoft were implanted. A randomized crossover block design was carried out in which participants were randomly assigned to two groups. One group received the manufacturer's standard frequency allocation (STD) at the initial activation of the audio processor, while the audio processors of the other group were set using ABF allocation. After three months, the setting of the participants' audio processor was switched to the other filter bank allocation for a further three months. After this period, all participants then received two listening programs for a further three months, each with STD and ABF settings, so that they could determine their preferred setting themselves. Speech perception in quiet was measured using the Freiburg monosyllabic test at 65 dB SPL in free field. Furthermore, speech perception in noise was measured using the Oldenburg sentence test (OlSa) at a fixed speech level of 65 dB SPL and an adaptive noise level. The measurement was carried out in free field with speech and noise signal from the front (S0N0).
Creation of the anatomy-based setting (ABF)
Imaging was performed both pre- and postoperatively. Preoperatively, computed tomography (CT) imaging using OTOPLAN® 3.0 (CASCINATION AG, Bern, Switzerland) was used to calculate the CDL and model the insertion depths of the individual electrode contacts to determine the design (length) of the electrode to be used. Using postoperative cone beam tomography (CBT) images, the position of the individual electrode contacts within the cochlea was determined by OTOPLAN. OTOPLAN calculates the center frequencies of the band pass filters based on the position of the electrodes according to the formulas of Alexiades et al. [3], Escudé et al. [4] and Greenwood [5] (details in Goos and Baumann [6]). Since the tonotopic frequency allocation in the cochlea is not linear, but rather logarithmic towards higher frequencies, as reflected in the Greenwood function, the STD fitting provided by MED-EL is mainly based on a logarithmic distribution of the band filter center frequencies. Thus, in the basal region of the cochlea, STD and ABF assignments are very close. The corresponding center frequency was imported into the clinical fitting software MAESTRO (version 9.0.5, MED-EL, Innsbruck, Austria) and displayed within the frequency band allocation preset by the manufacturer (range 70–8,500 Hz). The implemented tonotopic organ of corti (OC) allocation calculated by OTOPLAN was then used as center frequencies. This allocation ensures that the filter banks within the middle electrode contacts of the audio processor correspond to the tonotopic center frequencies within the cochlea. At the same time, filter banks are compressed in the basal region and enlarged in the apical region. For this reason, we individually adjust the frequency allocation within the study to obtain an allocation of the frequency bands closer to the calculated OC center frequencies. The lower cut-off frequency of the most apical electrode contact (E1) is increased to shift the lowest center frequency towards the calculated OC-frequency. In some cases, electrode 12 was switched off if this resulted in a more precise frequency allocation or if it was clearly above the stimulation limit of the audio processors (>8,500 Hz). MCL and THR settings of the audio processor were checked during the visits in regard to the result of a categorical loudness test and adjusted if necessary.
3 Results
Hearing quality
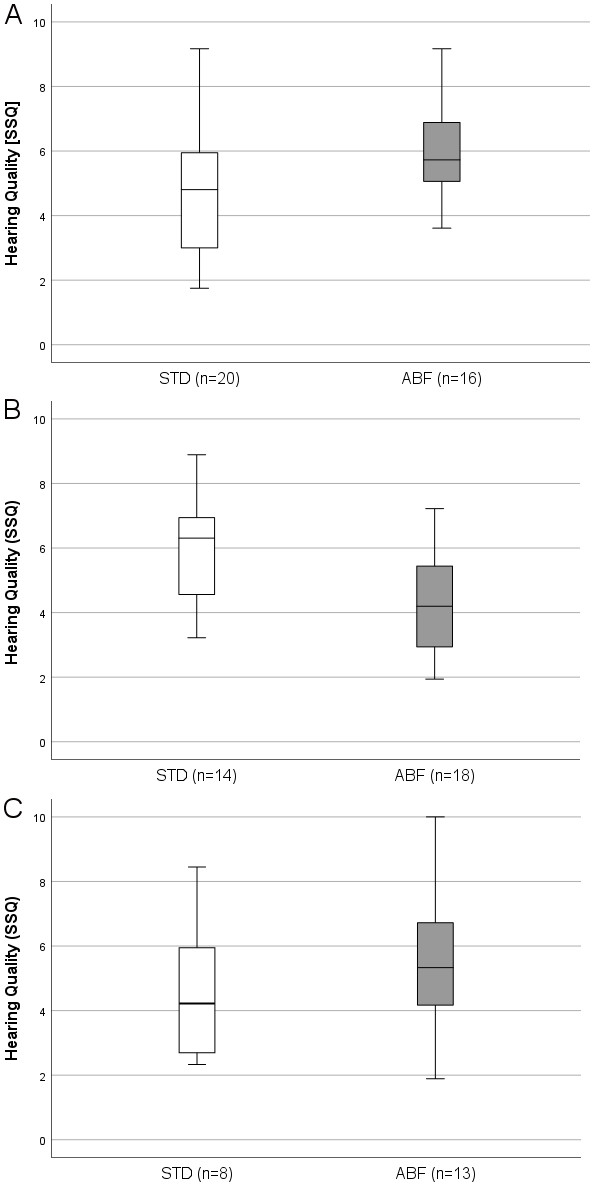
Figure 1 [Fig. 1] presents the boxplots of subjective hearing quality determined by the SSQ questionnaire (“Quality” part of the SSQ). Panel (A) shows the assessments of hearing quality at the first visit (3 M post initial activation). The group with the standard frequency distribution (STD) achieved a mean hearing quality score of 4.81 (±2), while the group with the anatomy-based frequency distribution (ABF) achieved a score of 5.73 (±1.5). This trend was reversed in the second visit (panel B), where the STD group reported a median value of 6.31 (+1.6), while the ABF group reported a value of 4.2 (±1.5). At the interval of study completion (9 M), the participants achieved a median score of 4.20 (±2.21) in the “preferred setting” group STD and 5.30 (±2.11) in the ABF group. “Preferred setting” group assignment was based on a setting preference questionnaire at the 9 M interval (study endpoint). If a participant rated both settings as equivalent, the setting with the longer time of use (as recorded by data logging) was selected. Of the 24 patients who have completed the study so far, 9 preferred the standard setting, 11 preferred the anatomy-based setting, and 4 participants had no preferred setting.
Speech intelligibility
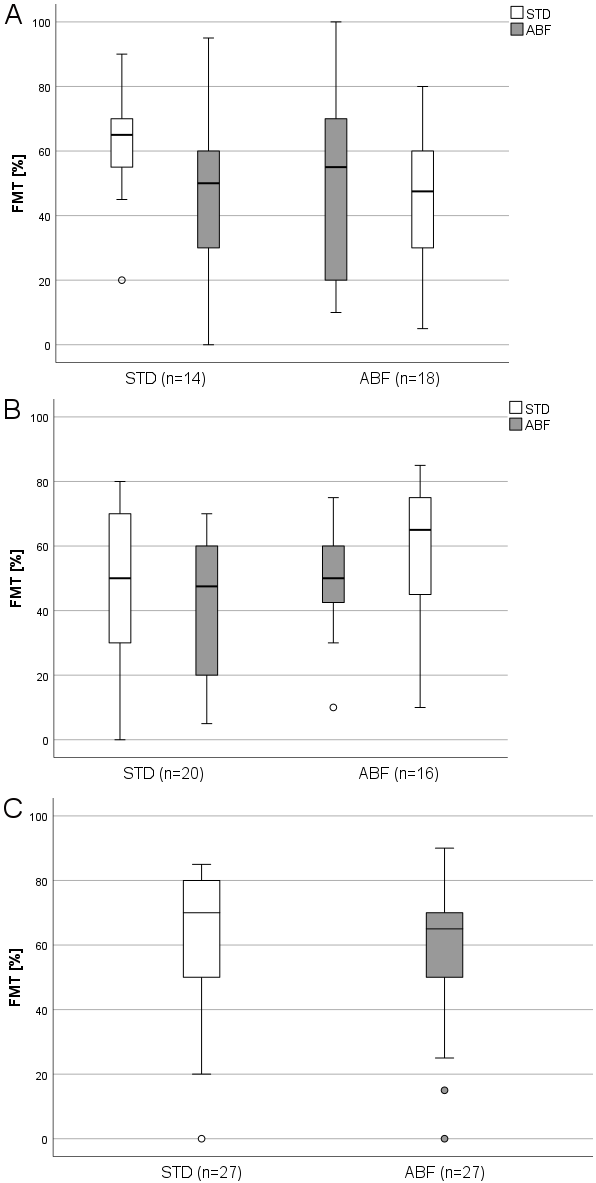
Figure 2 [Fig. 2] shows boxplots of the results of the Freiburg monosyllable test (FMT) in quiet related to the test interval. In the first interval (3 M), speech understanding in quiet in the group starting with STD was a median of 50% (±23%) and 48% (±21%) after switching to ABF allocation. The ABF starting group had also a median of 50% (±17%) and 65% (±20%) after switching to STD frequency distribution. At the second visit (6 M), median speech intelligibility in quiet was 65% (±16%) in the group with STD assignment and 50% (±6.1%) after adjustment for ABF assignment. The ABF group had a median of 55% (±30%) and 48% (±22%) after switching to STD frequency distribution. At the third visit (9M), the median speech understanding in quiet was 70% (±22%) for the STD preferring group and 65% (±22%) for the ABF preferring group. The results of the OLSA tests are not presented here and will be the subject of a later publication.
Dropouts
Switching between frequency allocations was often associated with acceptance problems, which seems to be primarily related to a change in the rating of sound quality. Most patients reported a deeper and sometimes warmer perceived sound perception in the ABF fitting. However, while some noticed little difference between STD and ABF allocation and showed similar results in the speech tests after switching between settings, others were found to experience degraded sound quality and poorer speech test results. The first was primarily observed in patients where the frequency allocations in both fittings exhibited only slight discrepancies from one another. Acceptance problems occurred more frequently at the first test interval (3 M) when the frequency assignment was changed for the first time. For example, some subjects reported that they experienced their own voice as too low and very unpleasant after switching from the STD to the ABF allocation. This was primarily observed in female subjects and is maybe related to female voice fundamental frequency (on average 220 Hz). So far, 8 of 16 patients who were labelled as dropouts were unable to cope the switch to the alternative frequency allocation and were removed from further study participation. Of these 8 subjects, 5 could not tolerate the switch to ABF and 3 to STD allocation. The immediate changeover effect and the possibility of initially perceiving the new setting as less effective, particularly during the three-month visit, may prevent long-term wear and a refusal of the other frequency allocation. Moreover, it is essential to monitor the duration of use of both frequency allocations at the nine-month appointment. It should be noted that not all participants necessarily changed between the two different frequency allocations. It is possible that prolonged exposure to a single setting could result in differences in speech intelligibility.
4 Discussion
The current results of this ongoing study suggest that ABF may improve hearing quality in CI users without compromising speech understanding in quiet. The trend towards better hearing quality with ABF in the first and last test intervals is encouraging and may indicate that participants are becoming accustomed to the anatomy-based frequency allocation of the filter bands and are able to take advantage of the potential benefits. One important point, however, is the acceptance problem that was observed in some participants when attempting to switch between frequency allocations at the first test interval after 3 months. Switching to an alternative frequency allocation can be a challenge and participants may need some time to get used to the new setting.
In terms of the speech intelligibility and hearing quality results obtained with ABF, recently published studies show similar results. Fan et al. [7] examined a group of 48 postlingually deafened adults who were divided into an anatomy-based and a standard frequency allocation (24 subjects each) group 6 months and 1 year after implantation. They found no statistically different results for speech intelligibility in quiet, but significantly better results for speech perception in noise and better ratings in terms of subjective hearing and music quality with ABF. Different to our study, no crossover design was implemented in [3], the lowest band pass filter was not altered, and basal electrodes were not deactivated to obtain more precise filter allocations in reference to OC-frequencies. Creff et al. [8] examined 26 newly implanted patients and applied a crossover study design over a period of 3 months. The authors reported better results in speech perception in noise for the anatomy-based group and no significant difference in speech intelligibility in quiet.
Contrary to [7] and [8], Lambriks et al. [9] showed better results for all test variables with the standard frequency distribution. In [9], however, patients were recruited who were implanted with a shorter electrode from the manufacturer Advanced Bionics (AB, Valencia, CA, USA). In contrast to longer electrode carriers like the ones from MED-EL investigated here, these electrodes could not achieve complete cochlear coverage. Therefore, it remains unclear whether frequency distortion is lower with ABF than with the standard frequency distribution for “midscala” or “SlimJ” electrodes.
Kurz et al. [10] examined 10 experienced bilateral patients and reported for an ABF group better speech intelligibility. In terms of the insertion depth of the electrode, [10] observed that an insertion angle (AID) of at least 620° improved ABF acceptance.
5 Conclusion
The preliminary results indicate that the anatomically determined frequency allocation of the bandpass filter center frequency setting may facilitate enhanced hearing quality while maintaining unimpaired speech perception in quiet.
6 Limitations
The final statistical analysis has not yet been completed and the present study contains only limited data on hearing quality and speech perception. A larger number of patients with final results is needed.
Notes
Conference presentation
This contribution was presented at the 26th Annual Conference of the German Society of Audiology and published as an abstract [11].
Funding
This study was funded by the German Federal Ministry of Education and Research (Project INDICI, 01KG2033).
Competing interests
The authors declare that they have no competing interests.
References
[1] Rader T, Fastl H, Baumann U. Speech perception with combined electric-acoustic stimulation and bilateral cochlear implants in a multisource noise field. Ear Hear. 2013 May-Jun;34(3):324-32. DOI: 10.1097/AUD.0b013e318272f189[2] Landsberger DM, Svrakic M, Roland JT Jr, Svirsky M. The Relationship Between Insertion Angles, Default Frequency Allocations, and Spiral Ganglion Place Pitch in Cochlear Implants. Ear Hear. 2015 Sep-Oct;36(5):e207-13. DOI: 10.1097/AUD.0000000000000163
[3] Alexiades G, Dhanasingh A, Jolly C. Method to estimate the complete and two-turn cochlear duct length. Otol Neurotol. 2015 Jun;36(5):904-7. DOI: 10.1097/MAO.0000000000000620
[4] Escudé B, James C, Deguine O, Cochard N, Eter E, Fraysse B. The size of the cochlea and predictions of insertion depth angles for cochlear implant electrodes. Audiol Neurootol. 2006;11(Suppl 1):27-33. DOI: 10.1159/000095611
[5] Greenwood DD. A cochlear frequency-position function for several species--29 years later. J Acoust Soc Am. 1990 Jun;87(6):2592-605. DOI: 10.1121/1.399052
[6] Gooss E, Baumann U. Factors influencing CI outcomes: Is there a correlation between electrode angular insertion depth/frequency mismatch and speech perception? HNO. Under review 2024.
[7] Fan X, Yang T, Fan Y, Song W, Gu W, Lu X, Chen Y, Chen X. Hearing outcomes following cochlear implantation with anatomic or default frequency mapping in postlingual deafness adults. Eur Arch Otorhinolaryngol. 2024 Feb;281(2):719-29. DOI: 10.1007/s00405-023-08151-1
[8] Creff G, Lambert C, Coudert P, Pean V, Laurent S, Godey B. Comparison of Tonotopic and Default Frequency Fitting for Speech Understanding in Noise in New Cochlear Implantees: A Prospective, Randomized, Double-Blind, Cross-Over Study. Ear Hear. 2024 Jan-Feb 01;45(1):35-52. DOI: 10.1097/AUD.0000000000001423
[9] Lambriks L, van Hoof M, Debruyne J, Janssen M, Chalupper J, van der Heijden K, Hof J, Hellingman K, Devocht E, George E. Imaging-based frequency mapping for cochlear implants - Evaluated using a daily randomized controlled trial. Front Neurosci. 2023 Apr 13;17:1119933. DOI: 10.3389/fnins.2023.1119933
[10] Kurz A, Herrmann D, Hagen R, Rak K. Using Anatomy-Based Fitting to Reduce Frequency-to-Place Mismatch in Experienced Bilateral Cochlear Implant Users: A Promising Concept. J Pers Med. 2023 Jul 8;13(7):1109. DOI: 10.3390/jpm13071109
[11] Geisen M, Helbig S, Weißgerber T, Stöver T, Baumann U. Anatomy-based fitting versus standard mapping of cochlear implants: A study on speech perception and hearing quality. In: Deutsche Gesellschaft für Audiologie e.V., editor. 26. Jahrestagung der Deutschen Gesellschaft für Audiologie. Aalen, 06.-08.03.2024. Düsseldorf: German Medical Science GMS Publishing House; 2024. Doc078. DOI: 10.3205/24dga078